
The Mid-Size LLC Flip Play
Why do landlords do certain things in certain places at certain times? The obvious answer is to make money.
But what type of money do they intend to make? What are the precise mechanisms they use to do that? Different landlords, often stretched across neighboring blocks, pursue competing, complimentary, and even mutually destructive strategies. You may find yourself living in a mid-sized apartment building. Not huge and new, not small and personal, somewhere in the middle. What is your landlord’s play? How secure is your housing?
Many mid-sized landlords, or those that own 2-5 multi-unit buildings or around 50-250 units, are using a strategy that leverages a net income stream to offset a debt load. They are not rich enough to buy anything with cash, but are rich enough to secure cheap capital at interest rates below what an individual could ever hope to attain. The tactics they use differ from both larger or smaller landlords, or slumlords or others who profit through more direct extortion. The move for many of these landlords is a game of playing the spread between interest rates, land price, and rent.
The stream of revenues created by the aggregate payments of tenants are used as collateral against loans, which are typically mortgages or private equity instruments. What they can charge in rent is determined by many things, largely the supply of housing at a location of similar quality (more on this later), the type and quality of the housing itself, and the relative bargaining strength of tenants as purchasers in the market. (degree of tenant monospony- no more on this later, a topic for another day.) The more they can charge in rent relative to land price and their debt obligations determines their efficiency and success as investors. In other words, they seek to maximize the rent they can charge against the lowest amount of investment. This combination of pressures typically puts the mid-sized landlord at the leading edge of renovation-driven displacements. In other words, their market tier is all about the brief hold and flip.
907 N Beacon
Many landlords will leave buildings unoccupied while they flip them. This can be due to damage, such as a fire, or general abandonment. In some cases, low occupancy is part of a strategy to secure a temporary reduction in assessed value to save on taxes while capital is secured, land price escalates, and renovation or sale becomes more feasible financially. The map below shows the number of units marked abandoned by the appraisal district in Dallas between 2019 and 2022. Larger dot size means more units, whereas darker color indicates later age.
Despite talk of a housing shortage, landlords are leaving hundreds of units empty, in some cases 40% or even 60% of a neighborhood’s total number of multifamily units. It is important to contextualize what a shortage of supply means to landlords. It does not mean that there are not enough rooms for people to rest at night. Housing, to a landlord, is a not a home. It means that their current deployment of capital, at current rental prices, is inefficient. It means there is a larger pool of people able to pay high rents than they can extract with the existing housing stock. It is not a shortage of absolute units, which does not exist, but instead a shortage of units operating at an efficiency that converts land value to income. It means that the existing apartments they own are not producing the same income they could earn if they wait a little longer or invest a little bit more.
Looking at these two maps, its clear East Dallas is an epicenter of landlord vacancy holding patterns. Zooming in on East Dallas in particular, there are a few properties along Gaston that warrant closer investigation.
This investigative method is how 907 N Beacon came up. A small, classic 50s style building located in a dense multifamily area.
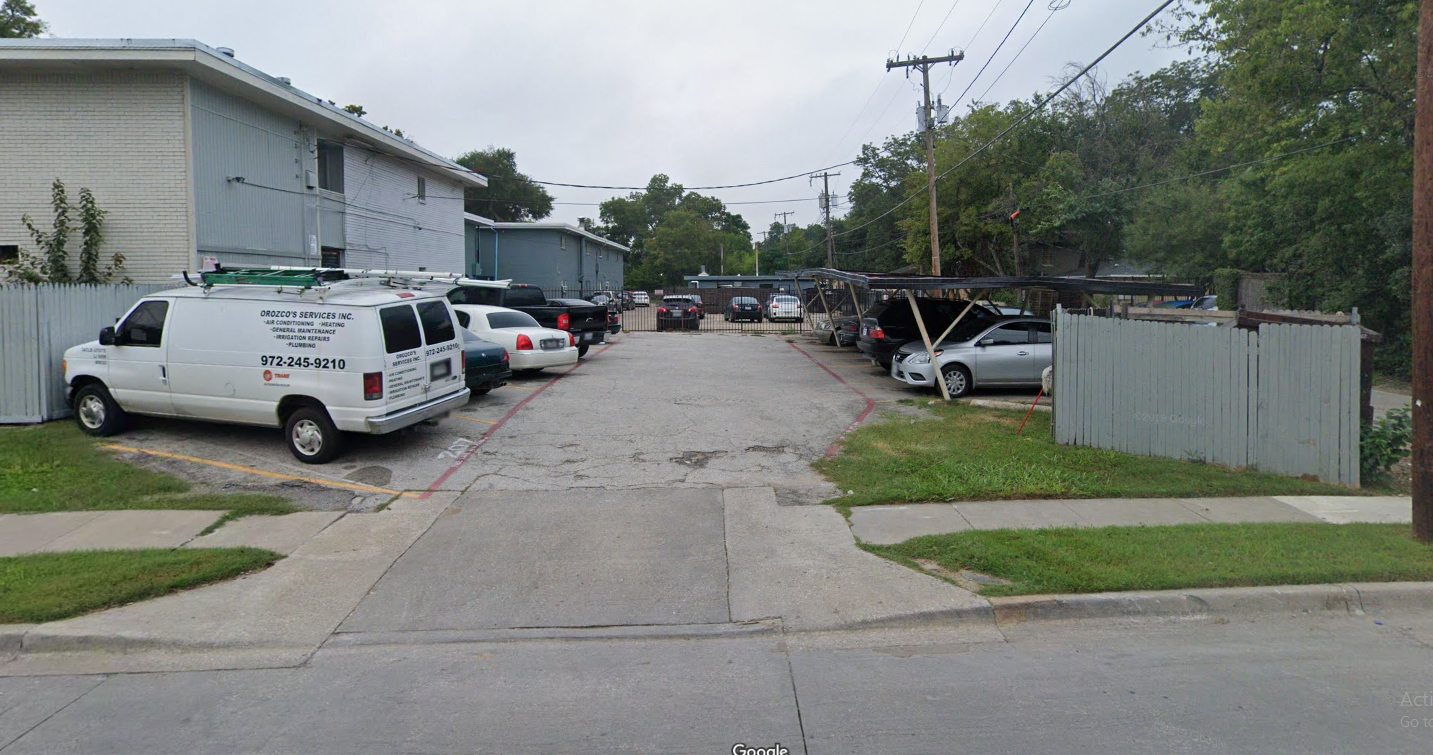
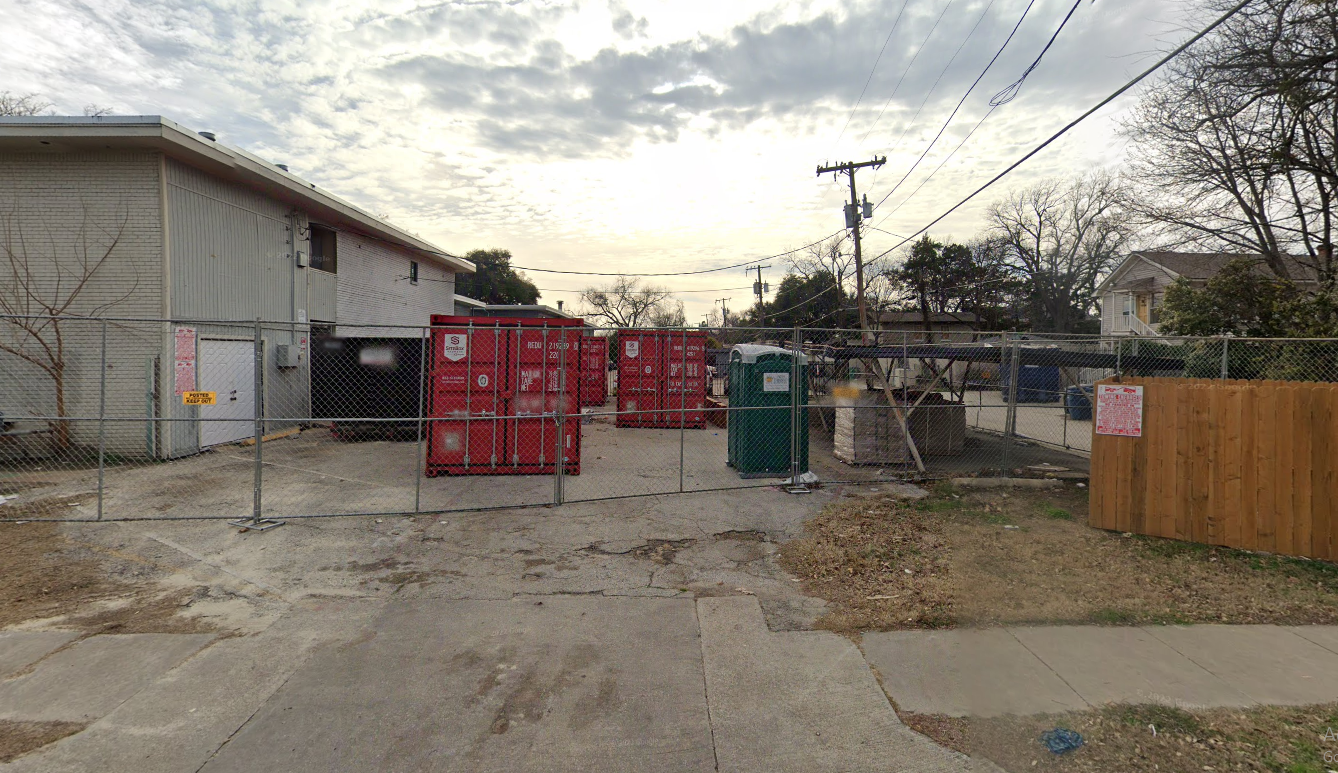
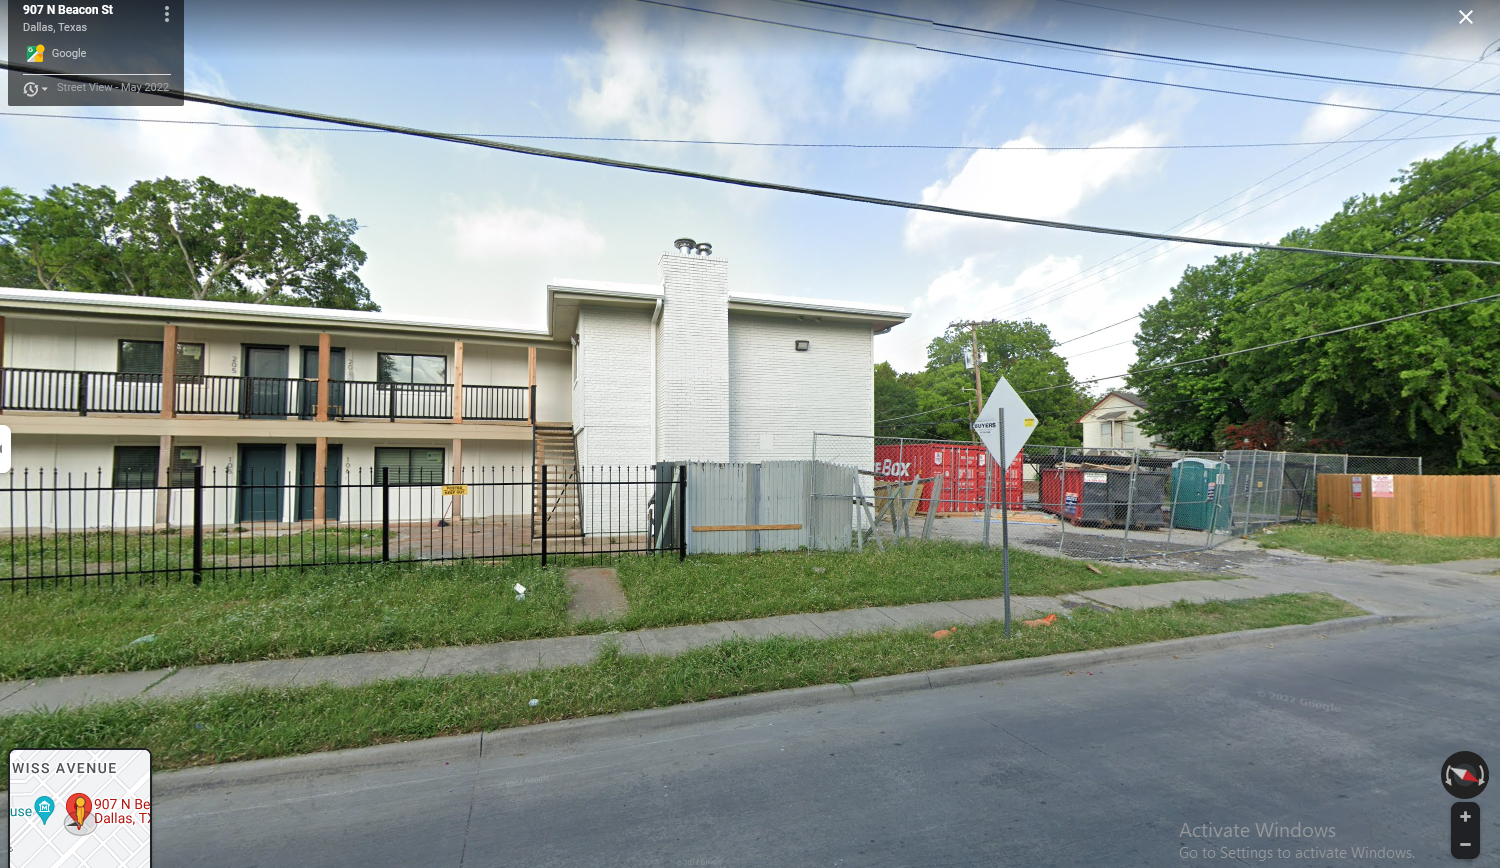
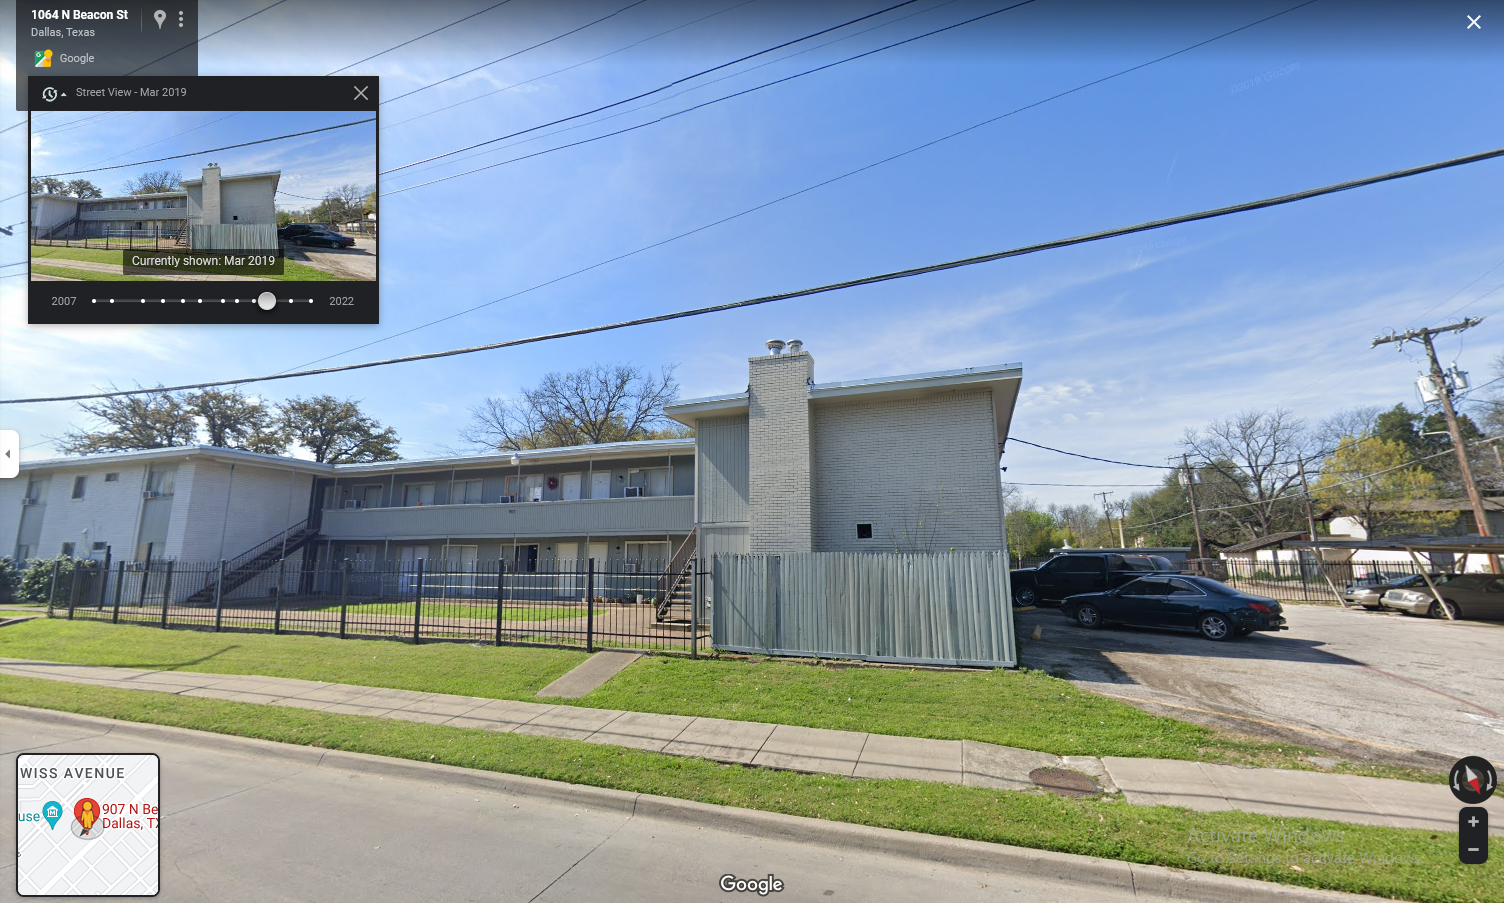

In short summary, this property was subject to a play by a flipper from Allen, TX. They first purchased the building in 2013, taking a loan at $385,000. Based on the number of units (14) and a typical 25% down payment, the property was worth around $580,000. By 2024, the property was worth $1,542,000. Put simply, the property owner realized a nearly 370% book value increase in 11 years. That average rate of return- nearly 35% per year- has it outperforming the overall stock market over the same period by nearly 50%. So how could these apartments, in this area, balloon in value so drastically? The pictures of the property hint at the answer- the landlord special.
By evicting the existing tenants and forcing them from the property, the landlord was able to extract nearly $500,000 of equity, which was redeployed to pay out investors and to flip the property itself. The value of these additions is reflected in higher operating rents, which now place the once affordable property well above where it was at.
This is the mechanism through landlords immiserate tenants, manufacture housing scarcity, and fill their own pocketbooks.
